Sizing the Language Services and Technology Market
X

Sizing the Language Services and Technology Market

Featured Content / For LSPs / LSP Market Sizing

In 2020, for the first time in 15 years, CSA Research did not release its annual sizing and forecast. We knew it would be irresponsible to forecast data-based market trends for 2020 or to make market predictions based exclusively on the Top 100 LSPs. Instead, we released three possible forecast scenarios to provide guidance for 2020 and 2021 in November of 2020. In March 2021 we published updates to the three scenarios and in November 2021 the Language Services Market. 

Read Why          Jump to Newest Data


Frequently Asked Questions

In a typical year, CSA Research relies on a statistical methodology (read more here) and a representative sample of 550+ LSPs from CSA Research’s supplier population of 27,000 LSPs to size the language market. CSA Research's in-depth annual survey accounts for double and triple counting.

Starting in November 2020 and with the March 2021 update, we have adjusted our model. Combining the 2019 baseline with our current annual Global Market Study, periodic quarterly surveys, as well as macro-economic data, we have produced three possible predictions (see the three scenarios here). 

Given that the uncertainty tied to the COVID-19 pandemic undermined even the most reliable statistical forecasting models, we decided to dive even deeper into numbers and estimates future outcomes with scenario modeling.

We evaluated three models in a sequence of increasing likelihood. Together, these three scenarios define the range of possibilities available from our 2019 and 2020 Global Market Surveys data and macroeconomic trends, as well as 4,296 responses to a series of surveys from March 2020 to March 2021.

It is unwise to statistically extrapolate the entire market from the Top 100 LSPs or even the Top 193 LSPs (CSA Research's ranking of the top 100 LSPs globally plus the top regional LSPs).

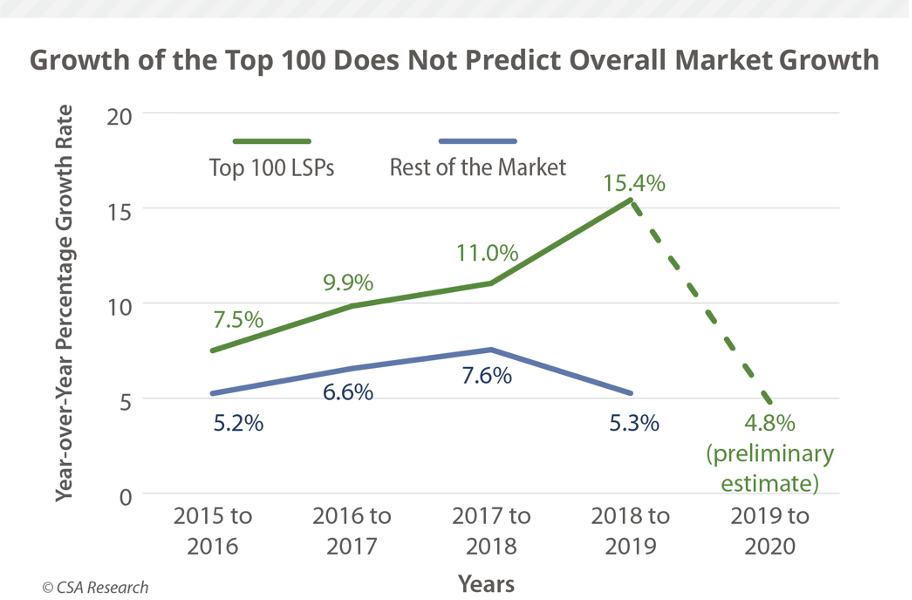
Since 2015, the Top 100 LSPs have grown an average of 83% faster than the rest of the market. The poor correlation between how the Top 100 LSPs or the Top 193 LSPs and the rest of the market have grown makes it impossible to generalize from one segment to the remainder.

This is particularly true of the last year (March 2020 - March 2021). Data in the report shows that smaller LSPs experienced significantly greater volatility during the COVID-19 pandemic.

Both the November 2020 and March 2021 scenarios are based on data gathered quarterly. We surveyed LSPs, Global Enterprises, Technology Vendors, and Freelancers regularly. 


The March update relies on the most recent survey data we collected in Q1 as well as current macro-economic forecasts.


Read the Report          Contact Us to Purchase
 

Have a question we didn't answer? Write to us!

Blogs

Get an overview of the size of the language service market on our blog.


March 2021 Scenarios

  • Pre-COVID
  • Scenario 1
  • Scenario 2
  • Scenario 3


Using our 2019 industry size forecast, we extrapolated growth to 2025 based on historical performance. Under this “no pandemic” model, the market would have reached US$51.94 billion in 2020 and US$54.17 in 2021.


This scenario represents the lowest bounds for market performance based solely on macroeconomic forecasts starting in 2020 without any adjustment for the economics of the language industry. It thus represents the lowest realistic – albeit extremely unlikely – bounds for industry performance.


Our second scenario uses the IMF forecasts for GDP as a baseline but adjusts it to reflect how the industry has overperformed historically against the economy as a whole.In this scenario, the industry reaches previously forecast revenue levels for 2020 in early 2021, but actually exceeds those predictions by 2022


This third model applies a growth rate of 4% based on a blend of recent surveys. Combining this growth with the forward-looking growth from the GDP+ scenario yields a situation in which the language industry narrowly misses our forecast from 2019 and then surpasses it in 2022 and beyond, but still falls far short of pre-COVID expectations for many LSPs.


Interested in the complete data? Contact us to purchase the report.